Dashboards
This guide aims to present and explain some of the dashboards available on the Stash Platform™.
SUMMARY
Concept of Time Range
"Time Range" is a feature that allows you to view data collection corresponding to a specific period.
In the top right corner of the dashboards, there is a button that enables interaction with the data already collected. In other words, if you want to see how much a machine produced the previous day, just use the Time Range.
Note: This option is available only within dashboards.
By clicking the button, you will see the following screen:
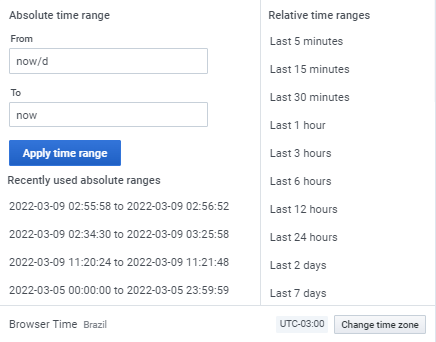
The screen displays several options that will make it easier to search for data by dates and times.
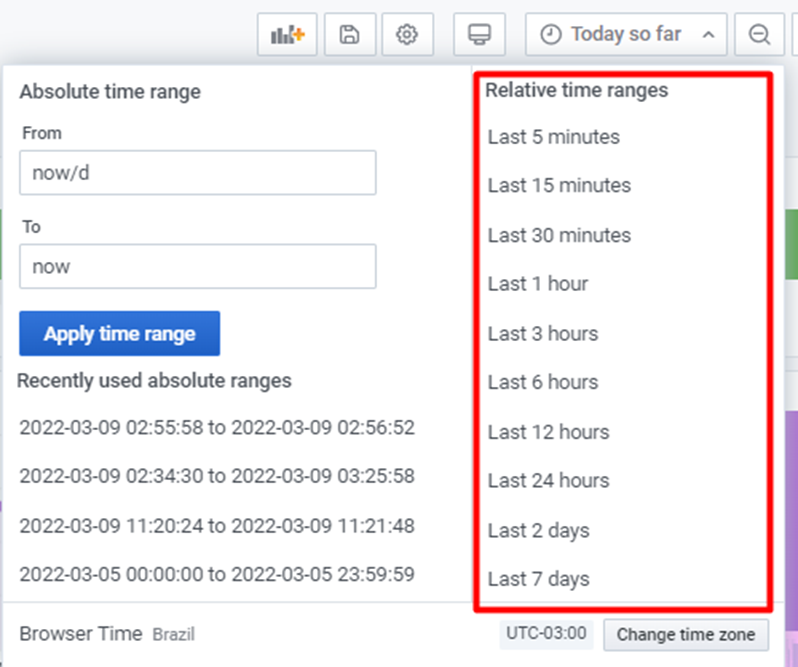
1. Relative Time Range
In the "Relative Time Ranges" column, you have access to a menu with predefined filters that allow you to select ranges from the last few minutes to the last days of data collection.
2. Absolute Time Ranges
Within the "Absolute Time Ranges" feature, you can select a specific range using two input boxes, where you can manually define the start and end of the period.
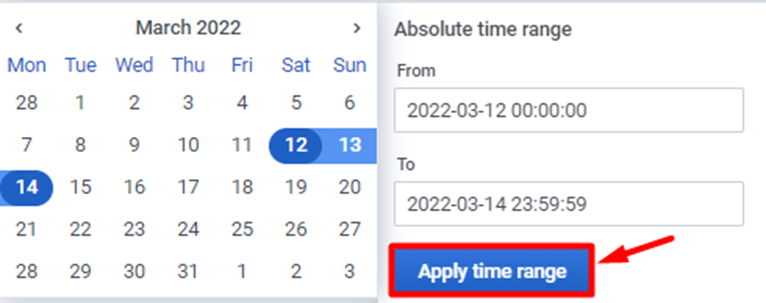
In the upper box (From), select a start date from the calendar on the left. Then, click on the lower field (To) and select the end date.

The start and end dates should be displayed as shown in the image below. Click on "Apply Time Range" to apply the filter and view the information corresponding to the selected period.
Dashboard: Failure Analysis
This dashboard displays data related to equipment failures, divided into two categories: Duration and Count.
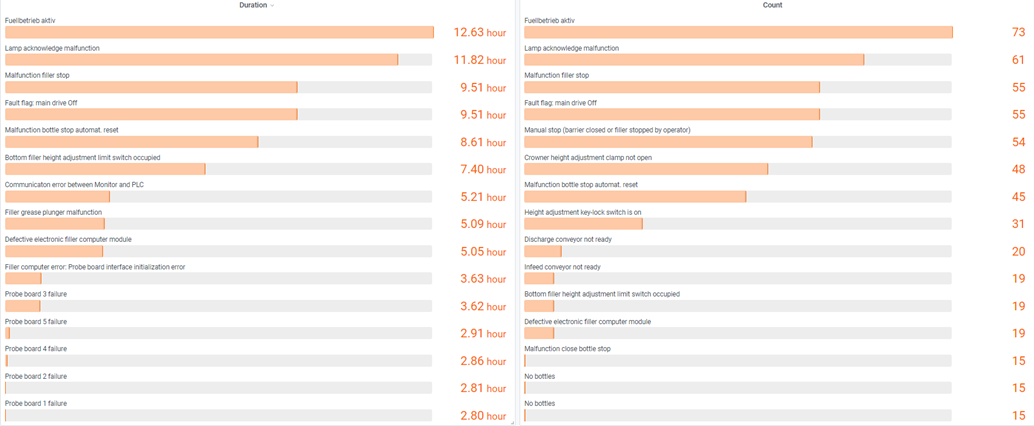
On the left side, in "Duration", you can view the failures that remained active for the longest time.
On the right side, in "Count", you can view the number of times a failure was triggered.
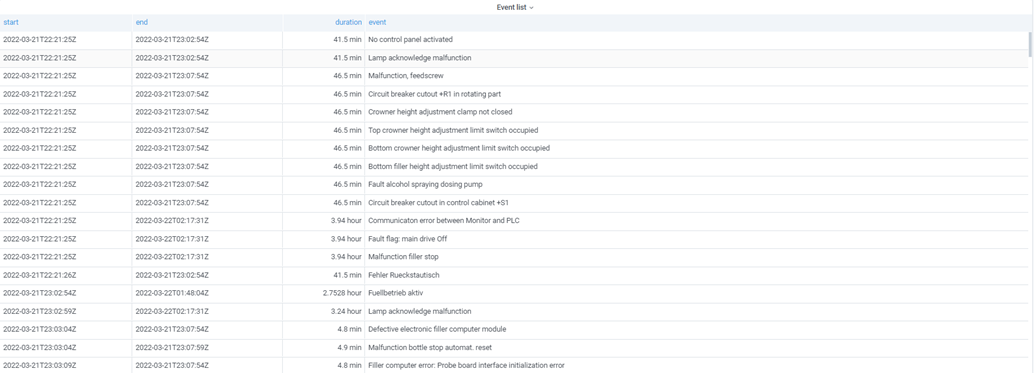
Dashboard: Failure List
This dashboard lists all the failures that occurred in a day, regardless of whether the failure was active for 5 hours or 5 seconds, for example. The failures can be classified by start, end, duration, and event.
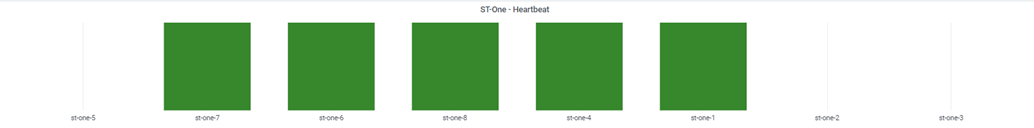
Dashboard: System Status
This dashboard, also called "ST-One Heartbeat," shows the status of the ST-One Hardware®: online or offline.
The green bar indicates that the device is online, while the line indicates that it is offline.
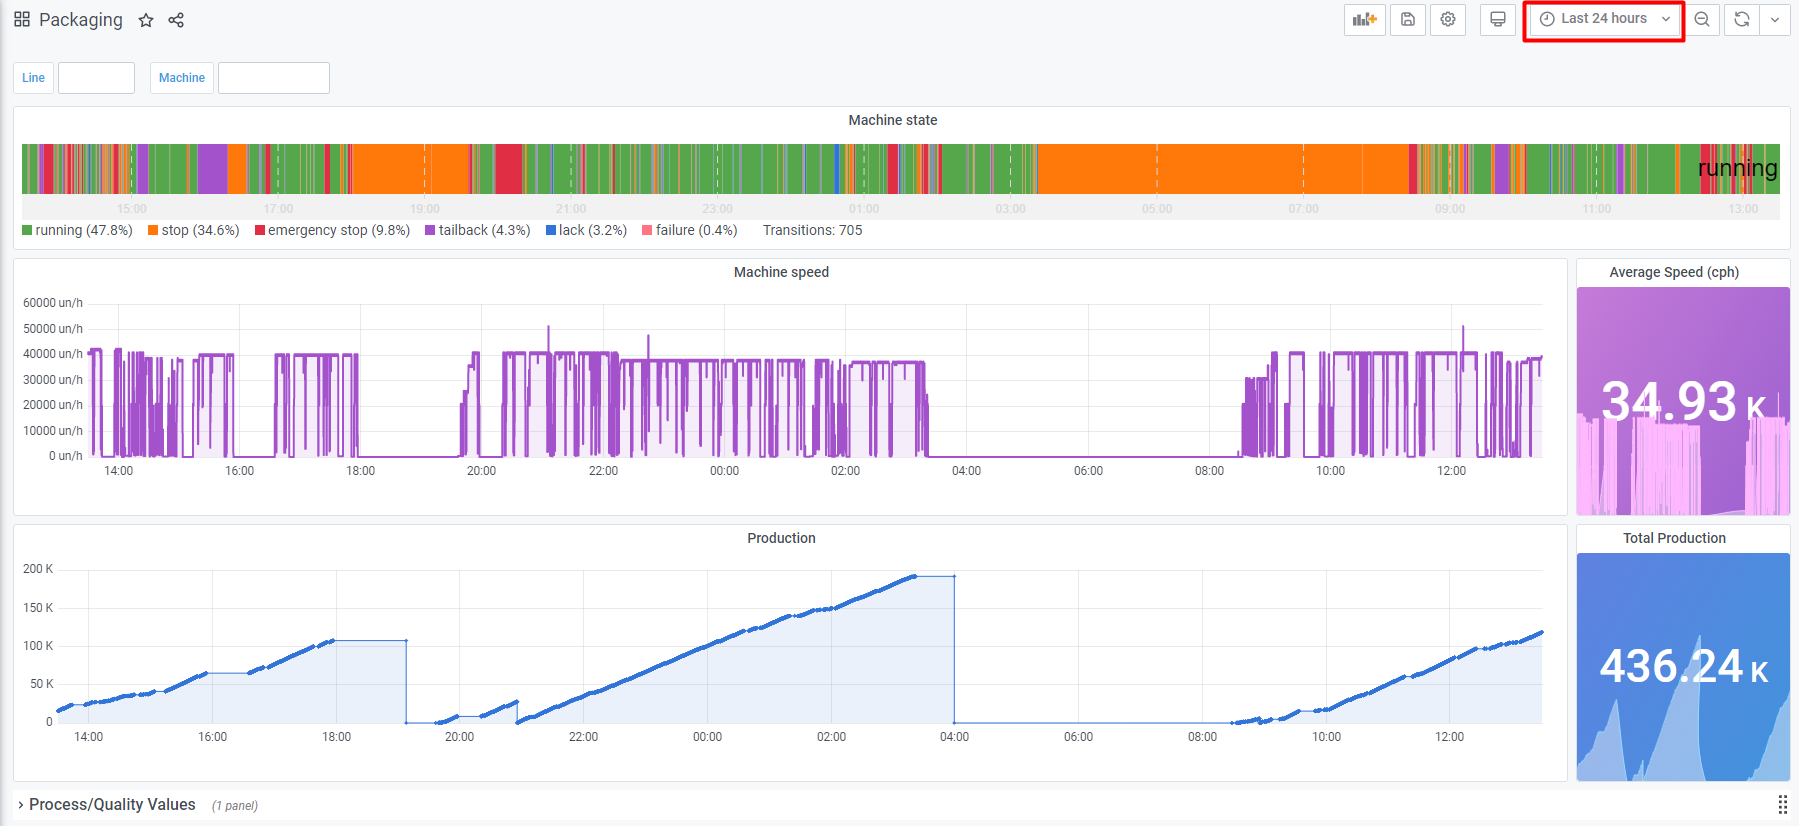
Dashboard: Packaging/Machine State
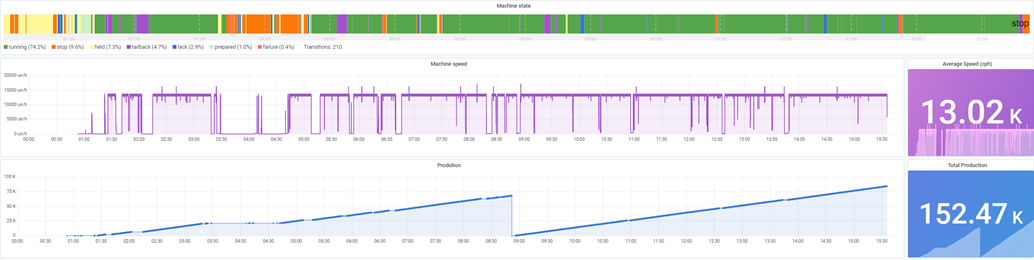
This dashboard contains 3 charts with different information:
- Machine State
- Machine Speed
- Production
1. Machine State
"Machine State" is represented by a timeline that shows the moments when the equipment was running or stopped. Additionally, the chart may display other statuses, such as LACK and TAILBACK. All other states can be checked through the Machine State article.

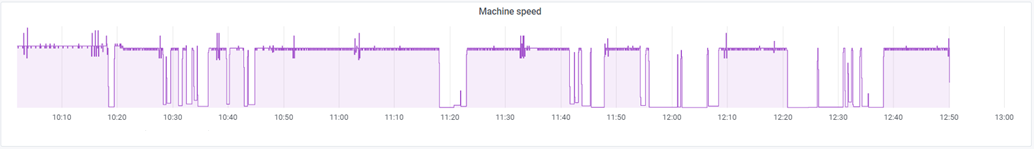
2. Machine Speed
The "Machine Speed" dashboard presents the average number of products produced within the "Time Range" selected by the user.
In the dashboard below, for example, a 3-hour period of "Machine Speed" was chosen. It will display the overall average production during these 3 hours.

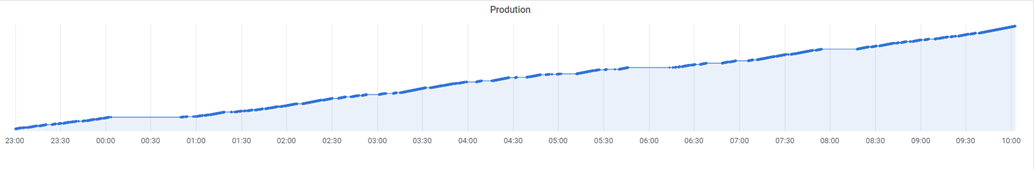
3. Production
In the "Production" dashboard, the equipment's production quantity will be displayed.
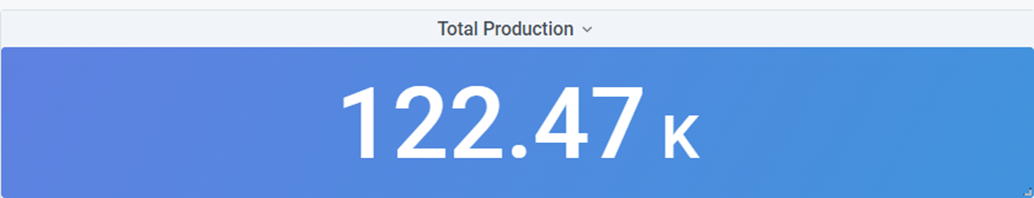
Note: The abbreviation "K" immediately after the numbers indicates the unit of thousand (thousand) and not kilogram (kg).
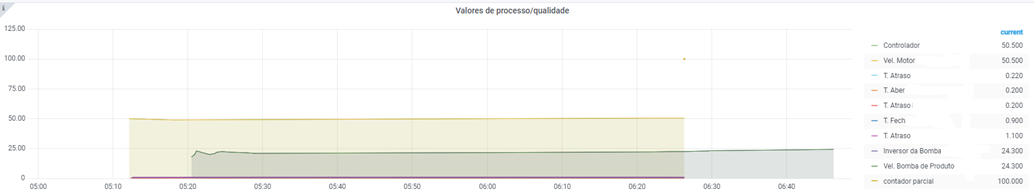
Dashboard: Process and Quality Values
In the "Process/Quality Values" dashboard, some parameters of the equipment are provided. Its purpose is to assist in identifying potential quality issues in a production line.
Special Dashboards
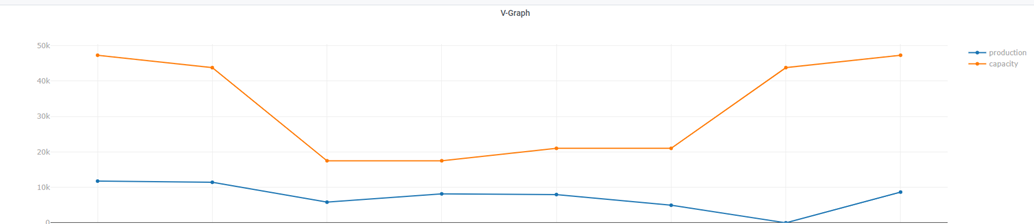
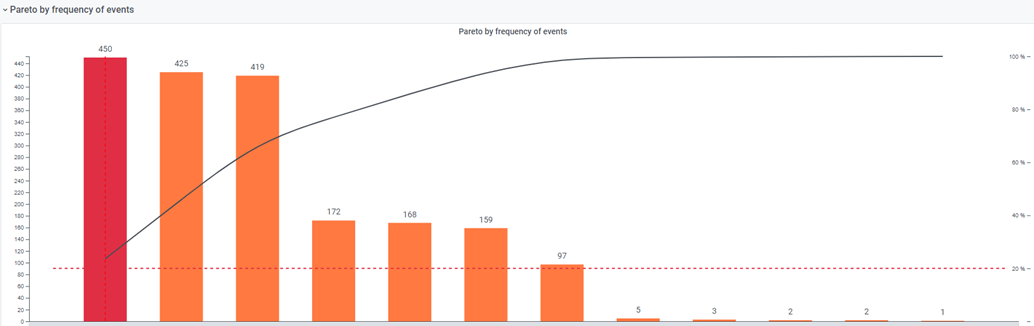
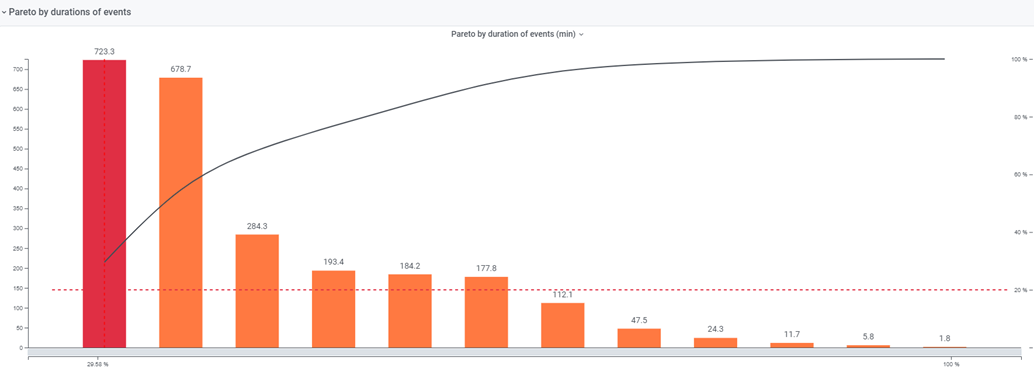
In addition to the mentioned dashboards, Stash Platform™ also supports custom charts, developed from specific requests for monitoring quality and production processes. Examples include the V-Graph and the Pareto Chart.
- V-Graph
- Pareto Chart
If you need or wish for a custom dashboard in your organization, please send a request email to support@st-one.io.